Facebook Vs. Google: Online Display Ad Network Bake-off
Google vs. Facebook Display Ad Bake-off
 With all the buzz of late resulting from the Facebook graph search announcement along with the continued dominance of Google in the online advertising industry, more and more marketers are evaluating display advertising opportunities in efforts to learn which display ad network deliver the most sales at the highest ROI. Since Google and Facebook dominate as the number one and two sites in terms of US as of Jan 2013 according to Compete.com (G),(FB), why not compare these two advertising behemoths to see how they stack up.
How does the relative value of advertising on the Google display network versus the Facebook? To answer that question, let’s review these leaders along the following dimensions:
assigning a letter grade to each of these five dimensions. This information from one of the best infographics that I have discoved in this context and was put together by WordStream and published in 2012, then augmented recent statics from other leading industry measurement leaders such as Compete, eMarketer and comScore.
While the data is a bit dated (e.g. Facebook mobile ads now abound), the comparison between these two industry giants is largely still valid and provides a valuable Internet marketing context for businesses evaluating ad buys on one or both of these.

Advertising Reach
The first question to asked is which advertising network is bigger? Facebook is the world’s largest social network with over 1 billion registered users. That represents over half of Internet users around the world. Since Facebook users are so engaged, Facebook generates over 1 trillion page views each month.
According to Compete.com, Facebook Reach Data for the US in Dec 2012 looked like this:
At the time of this post, Facebook reaches nearly 166 million unique visitors in the US each month, representing a nearly 13% YoY growth in reach in the US making Facebook second highest site in terms of reach in the US, second only to Google.
Now let’s compare that to Google, the world’s largest online display ad network, comprised of Google properties including YouTube, Google+ and Gmail. Google reaches over ninety percent of Internet users world wide with 180 billion ad impressions served each month. (Source: comScore US, Oct 2011)
According to Compete.com, Google Reach Data for the US in Dec 2012 looked like this:
At the time of this post, Google reaches nearly 173 million unique visitors in the US each month, representing a nearly 10% YoY growth in reach in the US making Google the highest site in terms of reach in the US. Based on the growth rates, Facebook is making up ground.
Revenues/Growth
Facebook Q1 2012 revenues were $1.06 billion. Facebook’s earning and revenue fell in the first quarter of 2012. Revenues in the first quarter were 6.5% less than revenues in the fourth quarter of 2011 with profit down 32% from the end of 2011. (Source: http://www.guardian.co.uk/technology/2012/apr/23/facebook-earnings-revenues-slip-ipo).
Google display ad network 2012 Q1 revenues totaled 2.9 billion. Note that this exclude $7 billion in revenue from Google search same quarter. Google display ad network’s earning and revenue fell in the first quarter of 2012. Revenues in the first quarter increase by 1% over revenues in the fourth quarter of 2011 with profits up .7% from the end of 2011.
In 2012, for the first time, Google surpassed Facebook as the digital display ad revenue leader in the US, with a projected 15.4% of the display ad market.

eMarketer projects that Google 2012 display revnues, net traffic aquisition costs, to be at $2.31 billion versus $2.16 billion for Facebook for the same period.

Advertising Performance
Now let’s look at which display ad networkprovides the best measurable ROI for their advertisers. what Facebook isn’t telling you about is risky ad business. For instance, 21% is a well accepted industry benchmarks for the average CTR (Click Through Rate) for banner ads in the United States.
Facebook does not publish its CTR, but independent analysis from WebTrends on more than 11,000 Facebook campaigns show that the average CTR for Facebook ads in 2010 was .051%. That rate, according to the WebTrends report, dropped from .063% in 2009 which some would claim points towards a downward trend. Source: http://venturebeat.com/2012/02/02/facebook-ctr.
According to TBG Digital, in Q1 2012, advertising rates rose 40% while click through rates dropped 8%. the feeling that marketers are paying for the concept the Facebook audience rather than reality is very difficult to shake. Source: http://www.fourthsource.com/social-media/does-facebook-really-deliver-for-advertisers-8167.
The average CTC for Facebook ads is $.80, though CPC can vary greatly based on advertiser targeting options and completion levels. Facebook average click through rates decline by half about two days after they launched. Source: http://articles.businessinsider.com/2011-01-31/tech/29956156_1_search-ads-display-ads-clickthrough.
On the other hand Google’s average CPC (Cost Per Click) is $.75 with CPC variance based largely on ad placement options and CTR. The average CTR on the Google online display ad network is .4%, almost 10 times as high a percentage as a Facebook ad. depending on the targeting options used, the CTR in the Google display ad network can up to 36 times higher. what’s amazing is that Google advertisers drive around 20% of their conversions to the Google display ad network. Source: http://www.periscopix.co.uk/blog/latest-2011-google-display-network-benchmarks/.
Advertiser Targeting Options
Now let’s take a look at who provides the most precise ad targeting options on the display ad network.
- Topics of interest and targeting – target users from predefined interest categories inferred from user browser history: Google only
- Keywording contextual targeting – use keywords to find webpages for your ads across the display ad network: Google only
- Remarketing – target ads to people who previously visited pages on your website as a browse other websites in the display ad network: Google only
- Education workplace and likes – target ads based on users memberships and interests from user profile and engagement: Facebook only (for now)
- Location-based targeting – target ads based on the user’s geographic location: both Google and Facebook
- Demographic targeting – target ads based on user’s actual age or estimated age range: both Google and Facebook
Ad targeting options that are not supported by Facebook include:
- no retargeting
- no partner sites
- no keyword-based contextual targeting
Facebook is not figured out mobile yet as there are currently over 425 million Facebook users who access their Facebook account through mobile device and until very recently they did not see ads. Facebook currently earns only a small portion of its revenue from ads served on Android and iPhone devices.
Source: http://www.businessinsider.com/facebooks-ad-business-distilled-into-12-crucial-facts-2012-2.
Ad Formats
Who supports the most engaging ad formats? Facebook has limited display advertising options for most advertisers. The Facebook ad includes a non-IAB compliant display ad unit with a title image and description. In addition, Facebook has the sponsored stories unit. one ad unit that Facebook has been testing out recently are large full-page advertisements that are indebted in the Facebook login page. These ad units are also shown when the user logs out of Facebook. This and other innovations that Facebook is delivering on its mobile ad network show signs of drivers for sustained revenue growth.
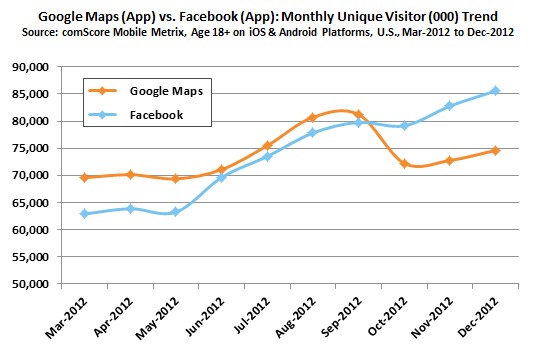
Growth in Facebook mobile is eveidenced by the fact that Facebook has overtaken Google Maps as the most populate mobile app to end 2012.
Some marketers and analysts say Facebook Since revenue potential by limiting its ad sizes. Facebook ads, and the corresponding prices they command, are small as compared with other sites because of an early decision of CEO Mark Zuckerberg to keep Facebook uncluttered.
Google on the other hand as a number of different advertising options including:
- text ads
- image ads including flash-based ad units.
- small square (200 x 200)
- square (250 x 250)
- banner (468 x 60)
- skyscraper (120 x 600)
- medium rectangle (300 x 250)
- ads in videos
- ads in mobile websites are games
Clearly Google has the advantage in terms of flexibility for ad formats currently supported.
Display Ad Bake-off Results
While Facebook remains clearly the world leader in social networking, the display ad bake-off has to go to Google, at least for now. While both Google and Facebook ad both networks both have tremendous reach, Google is the leader in advertising performance, flexibility and ad targeting options, and in ad formats supported.
While this is true today, like most things in Internet marketing, the only constant is change. With the recently announced Facebook Graph Search and their evolving relationship with Microsoft Bing and Yahoo! , focus on mobile advertising options, this bake-off will have to be revisited sometime in 2013.


Rick Noel is an experienced digital marketer enabling businesses and organizations to grow through the Internet, while maximizing marketing ROI (Return On Investment). Rick is the CEO and Co-Founder of eBiz ROI, Inc., a full-service digital marketing agency located in Ballston Lake, NY.
Leave a Reply